Benchmarking Visual Localization for Autonomous Navigation
WACV 2023
Lauri Suomela 1 · Jussi Kalliola 1 · Atakan Dag 1
Harry Edelman 2 · Joni-Kristian Kämäräinen 1
1 Tampere University · 2 Turku University of Applied Sciences

This work introduces a simulator-based benchmark for visual localization in the autonomous navigation context. The dynamic benchmark enables investigation of how variables such as the time of day, weather, and camera perspective affect the navigation performance of autonomous agents that utilize visual localization for closed-loop control. Our experiments study the effects of four such variables by evaluating state-of-the-art visual localization methods as part of the motion planning module of an autonomous navigation stack. The results show major variation in the suitability of the different methods for vision-based navigation. To the authors’ best knowledge, the proposed benchmark is the first to study modern visual localization methods as part of a complete navigation stack.
Benchmark
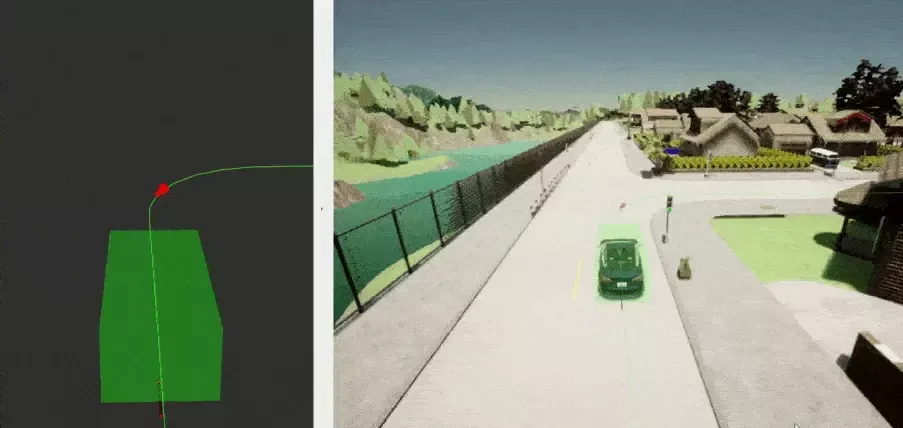
Visual localization is an active research topic in computer vision, but usually the localization methods are evaluated using static datasets and it is unclear how well the methods work when the visual localization output is used for closed-loop control. As a solution we present a benchmark which enables easy experimentation with different visual localization methods as part of a navigation stack. The platform enables investigating various factors that affect visual localization and subsequent navigation performance. The benchmark is based on the Carla autonomous driving simulator and our ROS2 port of the Hloc visual localization toolbox.
Experiments
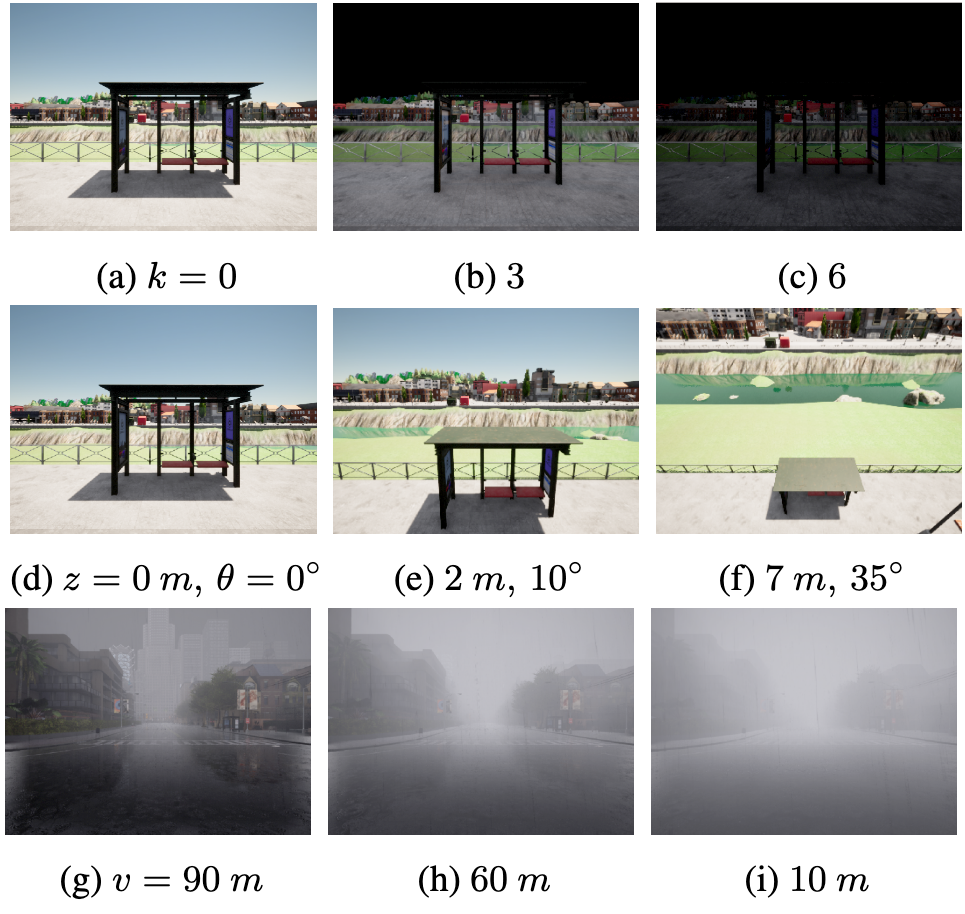
We conducted experiments to determine how well different hierarchical visual localization methods cope with changes in gallery-to-query illumination, viewpoint and weather change.

Results
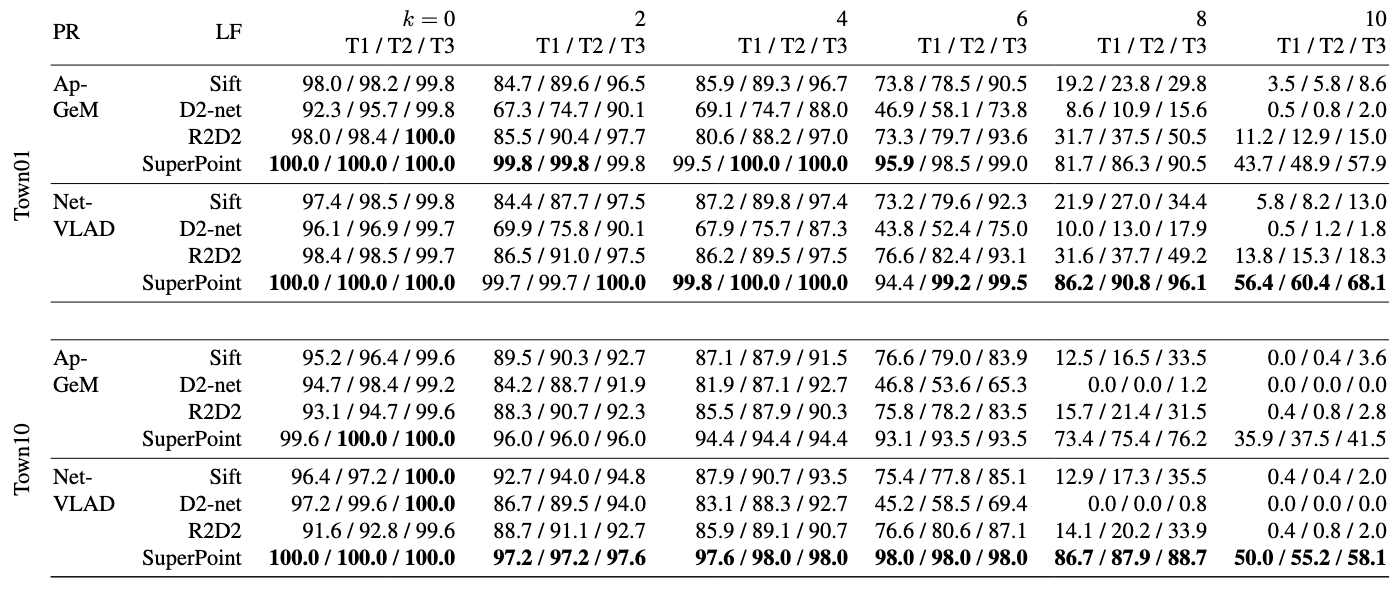
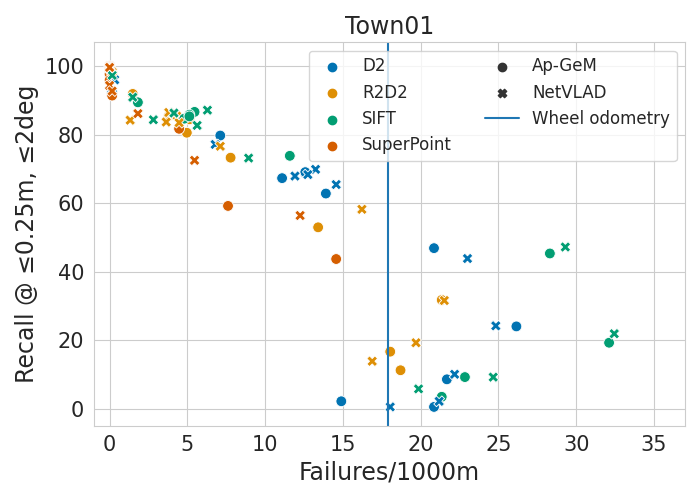
Quantitative results on two metrics: localization recall rate and navigation failure rate.

Combinations using SuperPoint achieve the lowest failure rates, and by a clear margin. The best performing combination is that of SuperPoint and NetVLAD, followed by SuperPoint with Ap-GeM. This follows a general pattern: The local feature method seems to have more effect on the performance than the place recognition method. Of the two place recognition methods, NetVLAD provides a slightly better performance.


SuperPoint, that achieves the lowest failure rates in different illumination conditions, also achieves the lowest failure rate for a given recall rate. There is a certain operation point, determined by odometry drift, after which changes in the recall rate become meaningless for autonomous navigation. Especially the second finding is interesting as it shows that visual localization performance needs to be sufficiently good in order to improve over wheel odometry only. For Town01, the recall rate of a method at threshold T1 has to be above 60% to benefit navigation. In other words, improving recall from 40% to 50% is almost meaningless while improvement from 60% to 70% is clearly significant.
BibTex
@InProceedings{Suomela_2023_WACV,
author    = {Suomela, Lauri and Kalliola, Jussi and Dag, Atakan and Edelman, Harry and Kämäräinen, Joni-Kristian},
title     = {Benchmarking Visual Localization for Autonomous Navigation},
booktitle = {Proceedings of the IEEE/CVF Winter Conference on Applications of Computer Vision (WACV)},
month     = {January},
year      = {2023},
pages     = {2945-2955}
}